
.avif)
Sales revenue analysis helps uncover your top-performing products by analyzing real revenue data, not just sales volume. It offers actionable insights for smarter decisions, forecasting, and growth. With the right tools and techniques, you can turn data into a strategic advantage. Want to make better calls on what to sell, scale, or sunset? Start with mastering your sales revenue analysis.
What’s your next step in analyzing your sales performance?
Identify high-revenue products in minutes.
What is Sales Revenue Analysis?
Sales revenue analysis is the process of evaluating your sales data to understand which products or services are generating the most income over a specific period. It helps businesses track performance, spot trends, and make informed decisions based on actual revenue generated, not just volume sold.
Why It's More Than Just Sales Numbers
Many businesses look at sales volume or units sold. But that doesn't tell the whole story. For example, you might sell 1,000 units of a low-priced item, but if your premium offering brings in five times more revenue with fewer sales, it’s clearly the top performer. This is where sales revenue analysis makes a difference.
Key Objectives of Sales Revenue Analysis:
- Identify top-performing products or services based on actual income
- Spot underperformers dragging down revenue
- Understand customer preferences and buying behavior
- Make strategic pricing or promotional decisions
- Forecast future revenue based on trends and seasonality
Core Elements Involved:
- Total revenue per product/service
- Sales trends over time (daily, weekly, monthly, quarterly)
- Customer segments generating the most revenue
- Geographic or channel-based breakdowns of sales
- Cost vs. revenue comparison for profit analysis
Sales revenue analysis gives a deeper, more accurate view of what truly drives your business forward. When done right, it acts as a compass guiding everything from inventory to marketing and product development.
Get smart with sales revenue analysis.
Key Benefits of Sales Performance Analysis
Conducting a thorough sales performance analysis delivers several transformative benefits:
- Improved Resource Allocation: Focus efforts and resources on high-performing products to maximize ROI.
- Customer Demand Insights: Use customer demand analysis to adapt products and services to evolving customer needs.
- Forecasting and Risk Mitigation: Anticipate market changes and prepare for potential challenges with accurate forecasts.
- Enhanced Sales Team Performance: Provide sales teams with insights on best-selling products to improve their approach.
- Strategic Product Development: Identify gaps in offerings and innovate new products based on customer preferences.
- Improved Marketing Effectiveness: Tailor marketing campaigns highlighting high-performing products and attracting more buyers.
- Optimized Inventory Management: Ensure stock levels align with demand to avoid overstocking or shortages.
- Higher Customer Retention Rates: Focus on products with high satisfaction ratings to build loyalty and encourage repeat purchases.
- Increased Profit Margins: Concentrate on products with favorable cost-to-profit ratios to enhance financial outcomes.
- Data-Driven Decision-Making: Empower managers with accurate insights to make informed and strategic choices.

For instance, a SaaS company analyzing sales insights reports might find that a premium subscription plan drives more revenue, leading to more focused marketing and feature enhancements for that tier.
Level up with revenue-based decisions.
This blog is just the start.
Unlock the power of Convin’s AI with a live demo.

Essential Steps to Perform Sales Data Analysis
Accurately identifying high-performing products starts with a structured approach to analyzing sales data. From collecting reliable data to refining strategies, each step helps businesses uncover trends and optimize performance. These essential steps provide a clear pathway to leveraging data for informed decision-making.
- Segment Your Data: Break down sales by product categories, customer demographics, and sales channels. This segmentation provides a clearer understanding of which segments drive revenue and where to focus efforts.
- Identify Key Metrics: Focus on average purchase value, sales frequency, and market share. These indicators help pinpoint high-performing products and areas needing improvement.
- Automate Data Collection: Use tools like CRM software or analytics platforms to streamline data gathering. Automation improves accuracy and saves valuable time for deeper analysis.
- Monitor Real-Time Data: Leverage live analytics tools to track ongoing sales trends and respond to market changes immediately. Real-time insights enable quick adjustments to strategies.
- Analyze Customer Behavior: Study customer buying patterns, preferences, and feedback to understand why certain products succeed. This analysis helps tailor offerings to meet customer expectations.
- Run Predictive Models: Apply predictive analytics to forecast future product demand using historical sales data. By leveraging advanced inventory forecasting tools, companies can automate demand prediction, minimize stockouts or overstock situations, and align procurement strategies with real-time market trends.
- Evaluate Marketing Impact: Analyze the correlation between sales performance and marketing efforts, such as campaigns or promotions. This insight helps optimize marketing budgets and focus on high-ROI activities.
Performing a comprehensive sales data analysis equips businesses with the insights needed to drive growth and efficiency. By following these steps, organizations can optimize their offerings, address customer demand, and achieve sustained success.
Unlock product insights with analysis.
Tools and Techniques for Effective Sales Revenue Analysis
Modern businesses rely on advanced tools and techniques to streamline sales data analysis, making insights more actionable and precise.
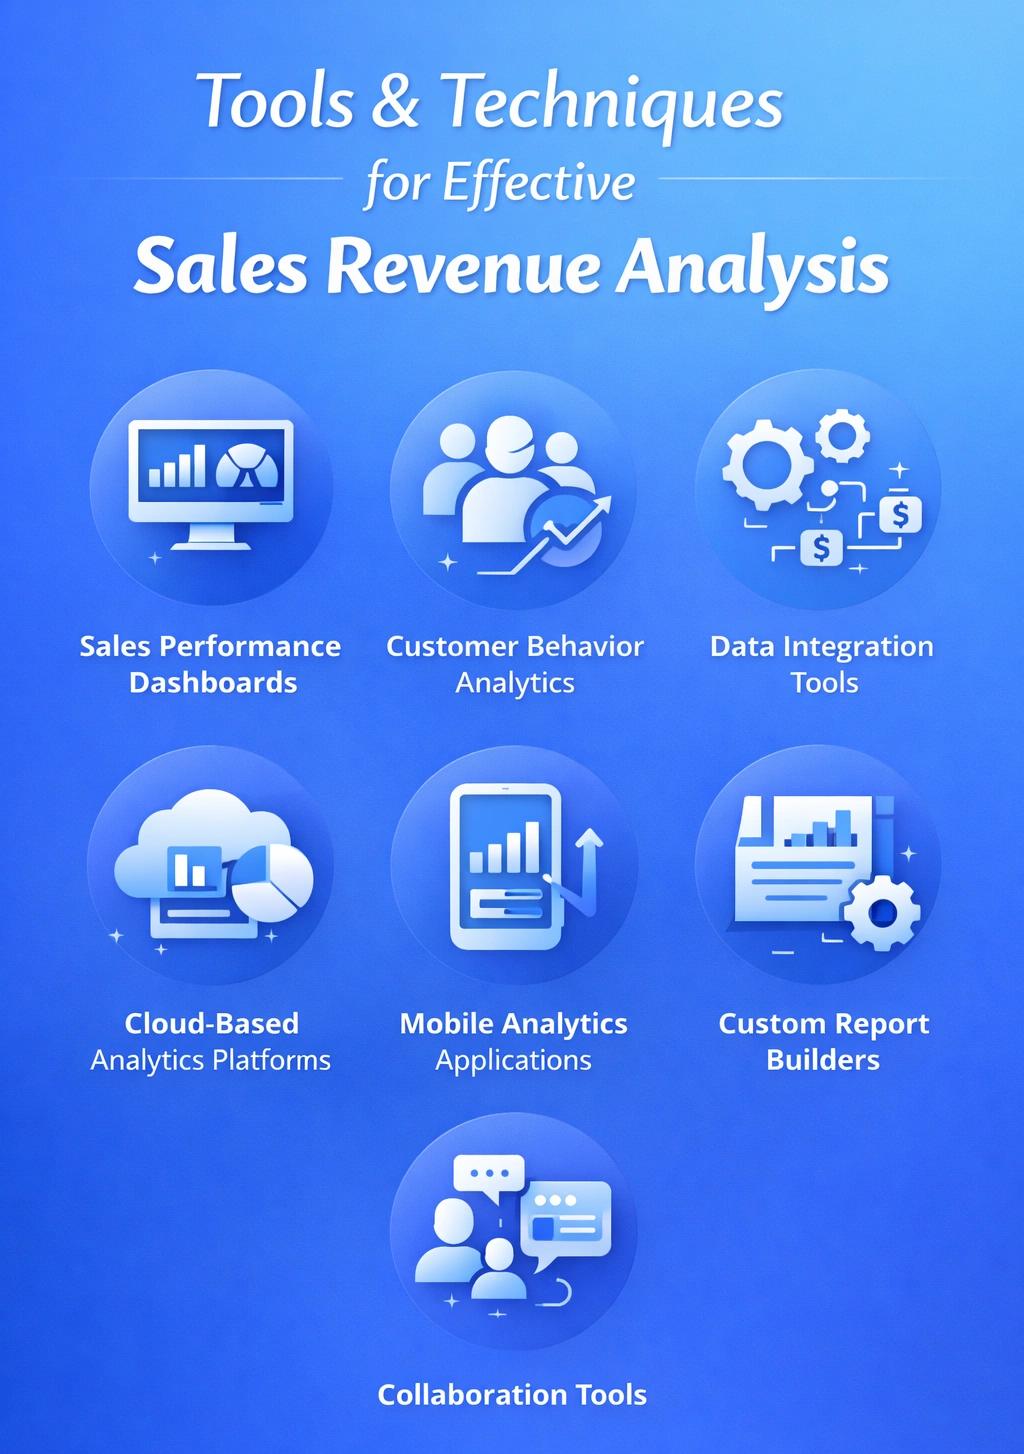
- Sales Performance Dashboards: Use real-time dashboards to visualize metrics like revenue, sales volume, and conversion rates. These dashboards provide an at-a-glance view of performance for quick decision-making.
- Customer Behavior Analytics: Tools like Google Analytics or Mixpanel help track customer interactions and buying patterns. Understanding these behaviors enables businesses to predict demand and improve offerings.
- Data Integration Tools: Platforms like Zapier or HubSpot integrate data from multiple sources, such as CRM, email marketing, and e-commerce systems. Centralized data ensures a cohesive analysis for better insights.
- Cloud-Based Analytics Platforms: Tools like Snowflake or AWS Analytics offer scalable solutions to store and analyze large volumes of sales data. Cloud platforms make data accessible anytime, ensuring uninterrupted analysis.
- Mobile Analytics Applications: Applications like Convin’s mobile app allow managers to track sales performance on the go. Mobile tools ensure constant access to insights, enhancing flexibility and responsiveness.
- Custom Report Builders: Use tools like Google Data Studio to create tailored reports that meet specific business needs. Custom reports highlight key areas, focusing on metrics that matter most.
- Collaboration Tools: Integrate tools like Slack or Microsoft Teams with analytics platforms for team-wide sharing of insights. Collaboration ensures everyone is aligned with data-driven strategies.
These tools and techniques empower businesses to perform more accurate, efficient, and scalable sales data analysis, helping them maintain a competitive edge.
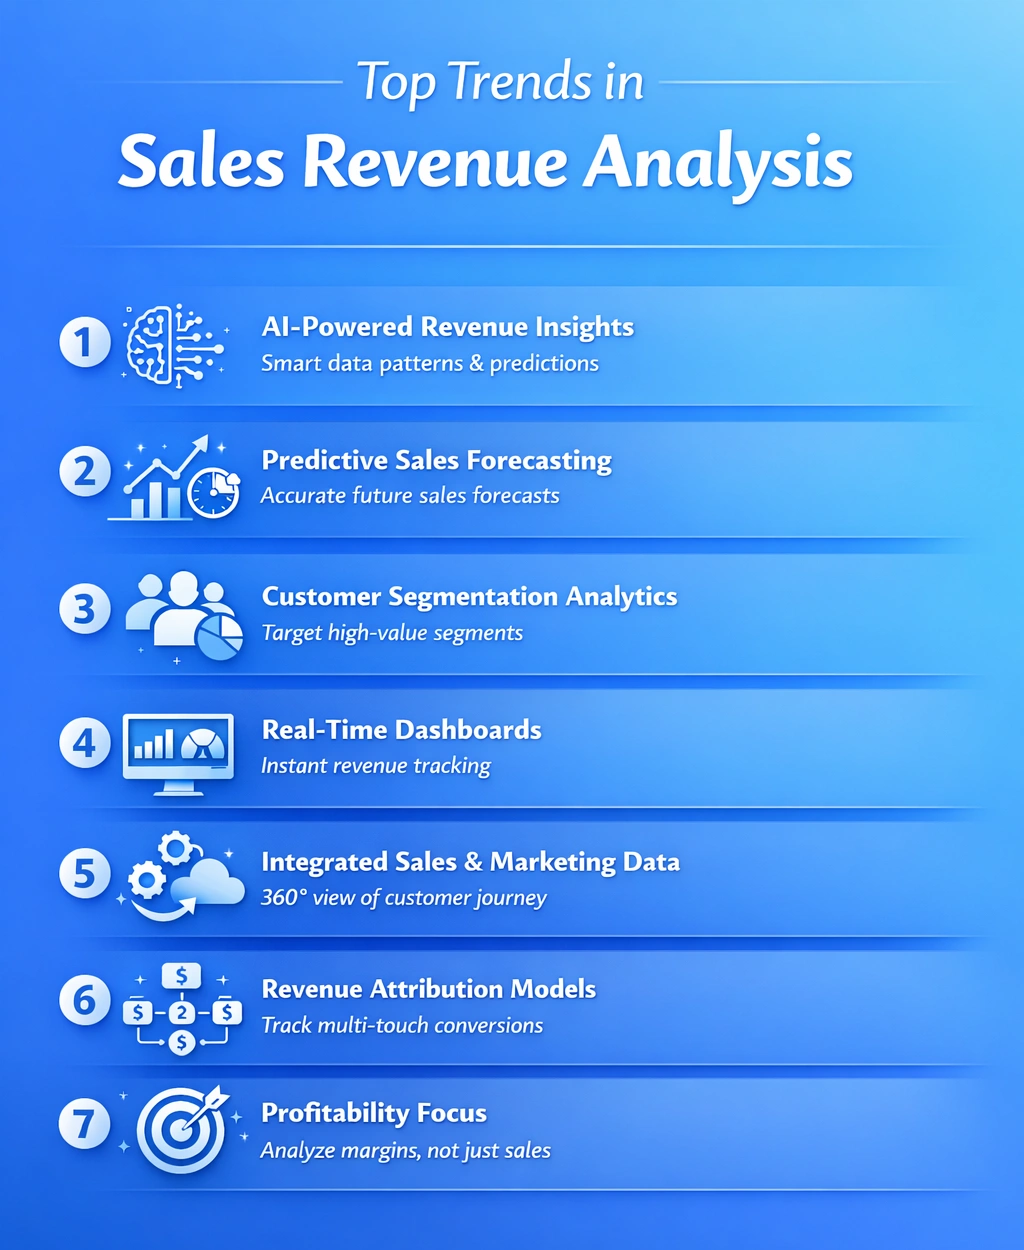
7 Top Trends in Sales Revenue Analysis
Sales revenue analysis is evolving fast with the rise of new tools, automation, and data-driven strategies. Staying ahead of these trends ensures smarter, faster decisions. Here are 7 key trends shaping the way businesses analyze sales revenue today:
1. AI-Powered Revenue Insights
AI is transforming revenue analysis by spotting patterns, anomalies, and predictions in real-time, giving businesses a smarter way to understand performance.
2. Predictive Sales Forecasting
Instead of just looking back, modern tools use historical data and buying behavior to forecast future sales with high accuracy.
3. Customer Segmentation Analytics
Segmenting customers based on revenue contribution helps tailor strategies to high-value segments, increasing ROI.
4. Real-Time Dashboards & Reporting
Live dashboards provide instant visibility into revenue shifts, allowing faster responses to sales trends or dips.
5. Integration Across Sales & Marketing Tools
Revenue analysis now pulls data from CRMs, marketing platforms, and call tools like Convin to provide a 360-degree view.
6. Revenue Attribution Models
Businesses are using multi-touch attribution models to understand which touchpoints contribute most to conversions and revenue.
7. Focus on Profitability, Not Just Revenue
Smart analysis goes beyond top-line numbers to look at profit margins, helping teams focus on products or services with the highest net gains.
Evaluate sales performance like a pro.
How to Use Insights for Sales Forecasting
Sales forecasting is vital for sustaining high-performing products and planning for future success. By leveraging insights, businesses can predict demand, refine strategies, and stay competitive.
- Historical Data Analysis: Analyze past sales performance to identify patterns and predict demand for top-performing products. Historical data provides a solid foundation for making accurate and reliable forecasts.
- Market Trend Integration: Incorporate industry trends and customer behavior into your forecasting models. Aligning forecasts with real-world trends helps refine projections and adapt strategies to meet market expectations.
- Scenario Planning: Create strategies for best-case, worst-case, and average scenarios to handle market uncertainties. Scenario planning ensures preparedness for varying conditions, reducing risks and optimizing opportunities.
- Sales Insights Reports: Utilize detailed sales analysis reports to guide production, marketing, and inventory management decisions. These reports highlight trends, helping businesses make data-driven adjustments. Incorporating QR codes for inventory management can further enhance efficiency by providing real-time tracking and streamlined stock control, ensuring accurate and up-to-date inventory management.
- Seasonal and Regional Trends: Analyze how demand changes by season or region to tailor inventory and marketing strategies. This granular forecasting improves customer satisfaction and minimizes waste.
- Resource Optimization: Allocate resources like workforce, budget, and materials based on forecasted demand. Proper resource planning helps maintain operational efficiency and reduce costs.
These steps ensure businesses stay ahead of market fluctuations, align offerings with customer needs, and maintain a competitive edge.
Book your Convin demo now!
Transform Your Business with Sales Revenue Analysis
Understanding your high-performing products or services is the cornerstone of sustainable growth. By leveraging sales revenue analysis, businesses can gain insights into customer demand, streamline operations, and make informed decisions.
Convin offers a robust suite of tools for sales data analysis and tracking, making it easier to identify top-performing products and forecast growth. With automated insights, predictive analytics, and real-time monitoring, Convin empowers businesses to stay ahead in a competitive landscape.
Take the next step toward growth by embracing sales performance tracking today. Uncover what works, enhance customer satisfaction, and confidently scale your business.
Frequently Asked Questions
How to analyse sales revenue?
To analyse sales revenue, track product-wise earnings over time, identify trends, compare against goals, and use dashboards or analytics tools to uncover your top-performing items or services.
How do you calculate sales revenue?
Sales revenue is calculated by multiplying the number of units sold by the selling price per unit. For services, it’s the total income from all client transactions.
How to perform a revenue analysis?
Start with accurate sales data, segment by product or region, compare performance over time, and use visual analytics tools to uncover revenue-driving trends and customer preferences.
What is revenue analysis?
Revenue analysis is the process of examining income data to identify trends, top-selling products, and customer behavior, helping businesses make smarter decisions and forecast future sales.


.avif)