

Insurance ops are under pressure, with rising call volatility, widening QA gaps, and tighter compliance windows. Leaders don’t want long pitches; they want proof fast. Dashboards have become the new decision currency.
In just 28 days, the right dashboards make conversational AI insurance impossible to ignore. These 10 visuals give COOs and PMOs fast, executive-ready proof, showing clearer CX, tighter SLAs, sharper triage, and real operational momentum that’s easy to scale.
Try Convin’s Conversational AI Insurance Playbook.
Why Conversational AI Insurance Needs A 28-Day Proof Window
A 28-day window forces clarity. It pushes teams to move past promises and get straight to signal: what shifted, how quickly, and whether the shift is strong enough for executive approval. And in insurance, where leakage, compliance pressure, and rising cost-to-serve collide, leaders don’t want theories anymore. They want dashboards that talk.
Over the last two years, insurance operations have changed faster than most orgs admit. Call volumes are choppier, QA gaps are wider, and customer expectations feel like they’re on fast-forward. As a result, decision rooms have shifted from “show me a deck” to “show me the data.” A 28-day pilot aligns perfectly with that shift because it compresses experimentation into a decision-ready timeframe.
By the end of this section, you’ll see why the right visuals, not long explanations, become your strongest proof weapon in a conversational AI insurance pilot.
The 28-day window is no longer arbitrary; it’s the tempo at which modern insurance ops move. And dashboards, not narratives, are what give executives confidence to act.
Now that we’ve set the pace, let’s walk through the 10 visuals that consistently shift executive rooms from curiosity to conviction.
Get Convin’s Top 10 Visuals For Insurance Pilots.
The Visuals That Matter In Conversational AI Insurance Pilots
The right pilot isn’t about volume of data; it’s about shaping the right evidence. Every COO and PMO looks for the same thing: “Show me where the needle moved and why.” This section breaks down the visuals grouped around real insurance workflows so leaders can see the impact instantly.
Below are the five secondary keyword clusters, each housing visuals that anchor a 28-day pilot and make your case undeniable.
AI In Insurance Contact Centers
Contact centers are where chaos shows up first, queues spike, handle times swing, and costs creep silently. A conversational AI insurance pilot must surface these movements quickly, which is why the first three visuals matter so much.

Visual 1: Capacity lift trendline comparing pre-pilot and pilot weeks
Visual 2: Handle time variance split by call type
Visual 3: Cost-to-serve before/after comparison
These visuals help an executive room understand where automation or improved efficiency absorbed operational load.
When COOs see operational swings in real numbers, capacity, handling, and cost, they instantly grasp the pilot’s material impact.
Insurance CX Automation
CX is where sentiment disengages long before metrics catch up. These visuals help leaders see how conversational AI insurance smooths friction and predicts CX movement.
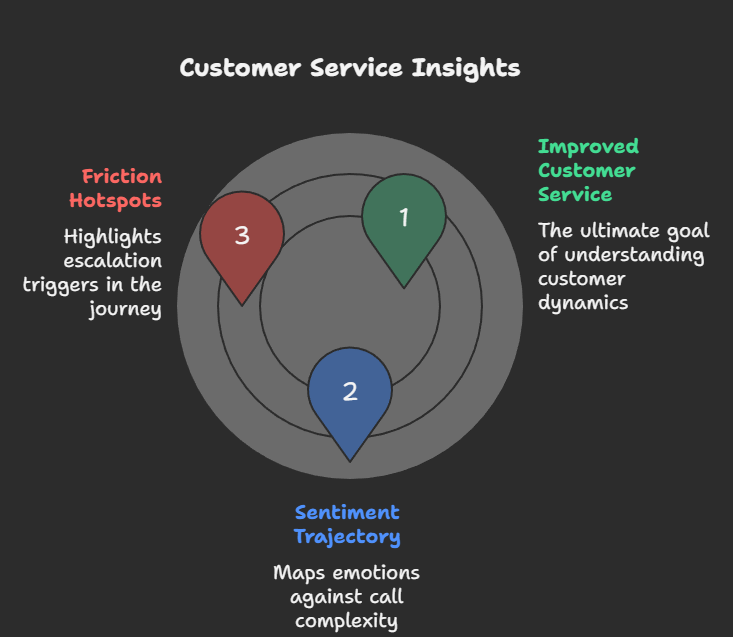
Visual 4: Sentiment trajectory mapped against call complexity
Visual 5: Friction hotspot visualization showing escalation triggers
The goal isn't to impress with color; it’s to make emotional and operational clarity visible in seconds.
When PMOs and COOs see sentiment stabilizing even before full automation kicks in, they know the future state is worth investing in.
Claims Conversational AI
Claims are the heartbeat of customer trust. A conversational AI insurance pilot must demonstrate how smarter triage and cleaner FNOL interactions reduce cycle time and downstream errors.

Visual 6: Claims triage accuracy vs. historical triage performance
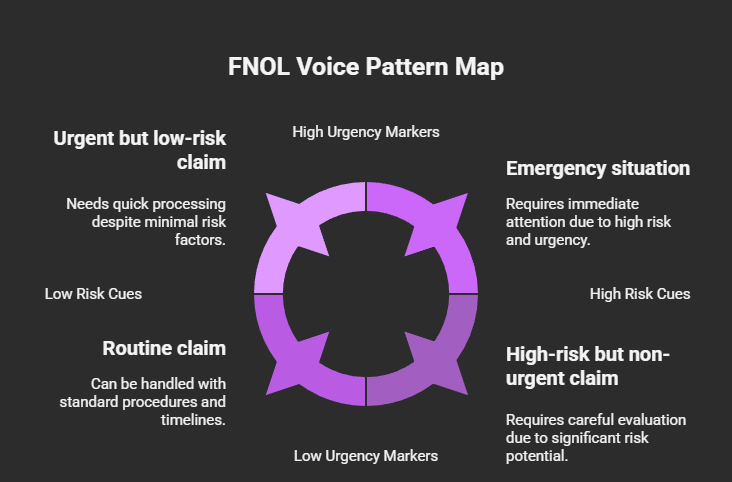
Visual 7: FNOL voice pattern map highlighting risk cues and urgency markers
These visuals show leadership how better insights at intake drive downstream savings and speed.
Claims leaders don’t need persuasion when triage accuracy spikes; even modest gains signal meaningful leakage reduction.
Underwriting Conversational AI
Underwriting thrives on precision and documentation accuracy. A pilot must reveal how conversational AI insurance identifies gaps earlier and speeds up completeness checks.
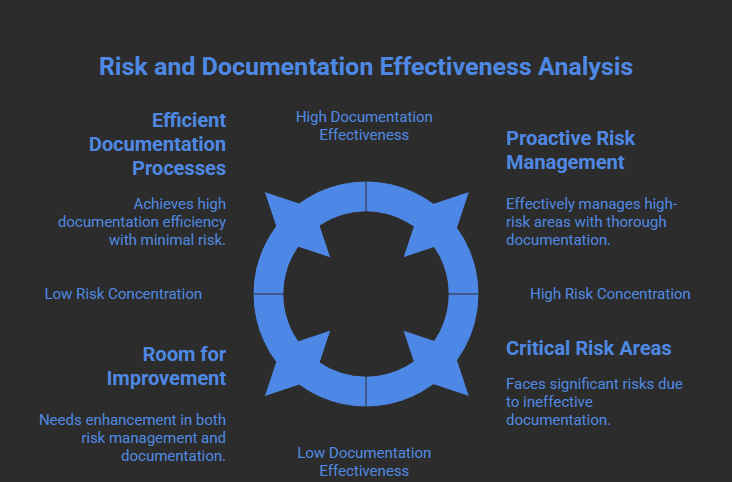
Visual 8: Risk-flag detection heatmap showing where red flags concentrate
Visual 9: Documentation completeness dashboard tracking turnaround patterns
These visuals resonate strongly with PMOs driving efficiency programs across functions.
When underwriting sees a cleaner, more predictable flow of cases, scaling conversational AI becomes an obvious next move.
Voice Analytics For Insurance
Voice analytics ties the entire insurance workflow together: claims, servicing, underwriting, compliance, and QA. A strong pilot surfaces hidden behavioral patterns.

Visual 10: Compliance phrase detection chart with deviation spikes
This final visual brings together the entire narrative: automated QA, operational transparency, and reduced compliance exposure.
Voice analytics doesn’t just validate the pilot; it often becomes the backbone for scaling the entire initiative.
With the 10 key visuals laid out, the next step is translating those visuals into ROI proof that fits within the 28-day pilot window.
Start A Fast Conversational AI Insurance Pilot.
This blog is just the start.
Unlock the power of Convin’s AI with a live demo.

How Conversational AI Insurance Proves ROI In 28 Days
Even in a short pilot, ROI in insurance isn’t abstract. The goal is simple: show measurable improvements fast, using dashboards that executives instinctively trust. This section highlights where the strongest early signals typically appear.
The visuals here connect directly to SLA performance and FCR movement, two metrics COOs watch obsessively because they link to cost, customer satisfaction, and operational predictability.
Insurance SLA Dashboards
SLAs tell leadership whether automation and analytics actually reduce friction, not just promise to. In a 28-day pilot, SLA movements are often visible by week two.
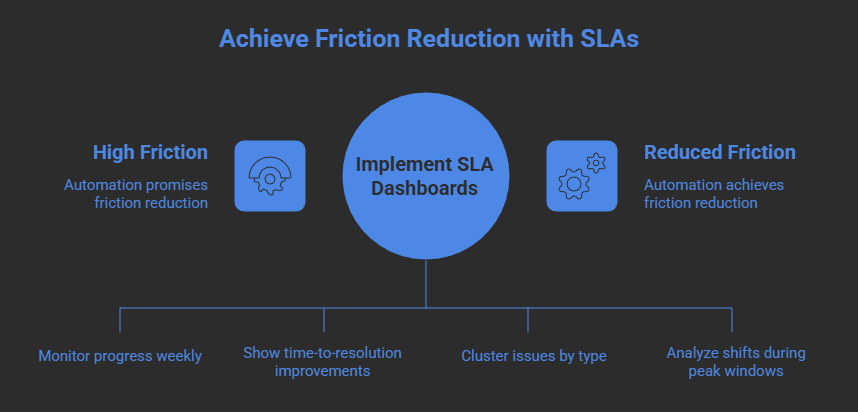
Visual examples:
- Time-to-resolution improvements
- Bottleneck detection via issue-type clustering
- Service pattern shifts during peak windows
SLA gains even small ones signal to executives that the pilot has operational legs and is worth scaling.
First-Contact Resolution Insurance
FCR is a powerful, early pilot indicator because it intersects cost, CX, and employee load. Conversational AI insurance improves FCR by reducing information gaps and pre-empting failure points.
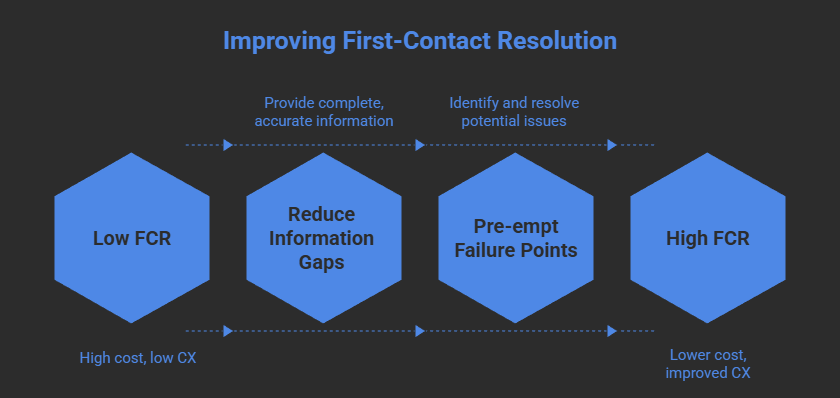
Visual examples:
- Repeat-contact trend
- Root-cause drivers for repeat calls
- Topic-level FCR breakdown
When FCR moves, decision rooms stop asking “should we scale?” and start asking “how fast can we replicate this across functions?”
Once ROI is visible, leaders need a clear decision journey. The next section maps your 10 visuals to the actual questions COOs and PMOs ask during approvals.
Check Convin Dashboards That Win Executive Rooms.
Mapping The 10 Visuals To A COO/PMO Decision Flow In Conversational AI Insurance
Executives don’t follow a linear proof process; they follow a question flow. Your visuals must answer that flow. This section aligns each visual with the exact decision checkpoints leaders use when evaluating conversational AI insurance pilots.

Typically, COOs and PMOs move through five questions:
- Did operations stabilize?
- Did CX move?
- Did risk reduce?
- Did cycle time shorten?
- Can this scale beyond the pilot?
Each visual crafted earlier answers one of these questions cleanly. Subtle Convin workflows, like automated QA, conversational insights, and multi-flow analytics, slot naturally into these decision checkpoints without feeling salesy.
When your visuals match the executive decision flow, you shorten the approval cycle dramatically and remove friction from scale discussions.
With the executive decision flow aligned, all that’s left is to wrap the narrative and offer a next step that’s light, helpful, and zero-pressure.
Schedule your Convin demo today!
The Fastest Path To Proving Conversational AI Insurance
A 28-day pilot becomes incredibly persuasive when every visual tells a story of movement, less friction, cleaner triage, better sentiment, sharper QA, and fewer repeat calls. These dashboards cut through opinions and give COO/PMO teams something far clearer: momentum.
If the visuals are strong, decisions are fast. And if decisions are fast, transformation doesn’t stall.
FAQs
- How do dashboards help validate conversational AI insurance in 28 days?
Dashboards turn pilot performance into clear visuals, showing shifts in CX, SLAs, claims triage, underwriting accuracy, and compliance so executives can see proof without long explanations.
- What are the 10 visuals that strengthen a conversational AI insurance pilot?
Capacity lift, handle-time variance, cost-to-serve trends, sentiment trajectory, friction hotspots, claims triage accuracy, FNOL patterns, underwriting risk flags, documentation completeness, and compliance phrase detection.
- Why are COOs and PMOs focused on visuals instead of slide decks in conversational AI insurance pilots?
Executives prefer real-time evidence. Dashboards reveal operational movement faster than narrative reports, helping them decide quickly whether a pilot should scale.
- How does a conversational AI insurance pilot show early operational impact?
Through visible improvements in sentiment, FCR, SLA performance, triage accuracy, and compliance detection, usually within the first two weeks.


%20BLOG10%20examples%20of%20artificial%20intelligence%20in%202024.webp)


.avif)